 Dulini Mendis
Data Viewer
Days of EEG, ECG and video from a patient's home, kept in sync in one view so clinicians can find the moments that matter.
Built with
- React
- TypeScript
- GraphQL
- Node.js
- PostgreSQL
- Python
- AWS
The story
Context
Diagnosing epilepsy often depends on capturing a seizure on a recording. Traditionally that meant days in a hospital bed, wired to an EEG. Seer moved it home. Patients wear the Seer Sense, which records brain and heart activity for up to ten days, while a hub in the home records video.
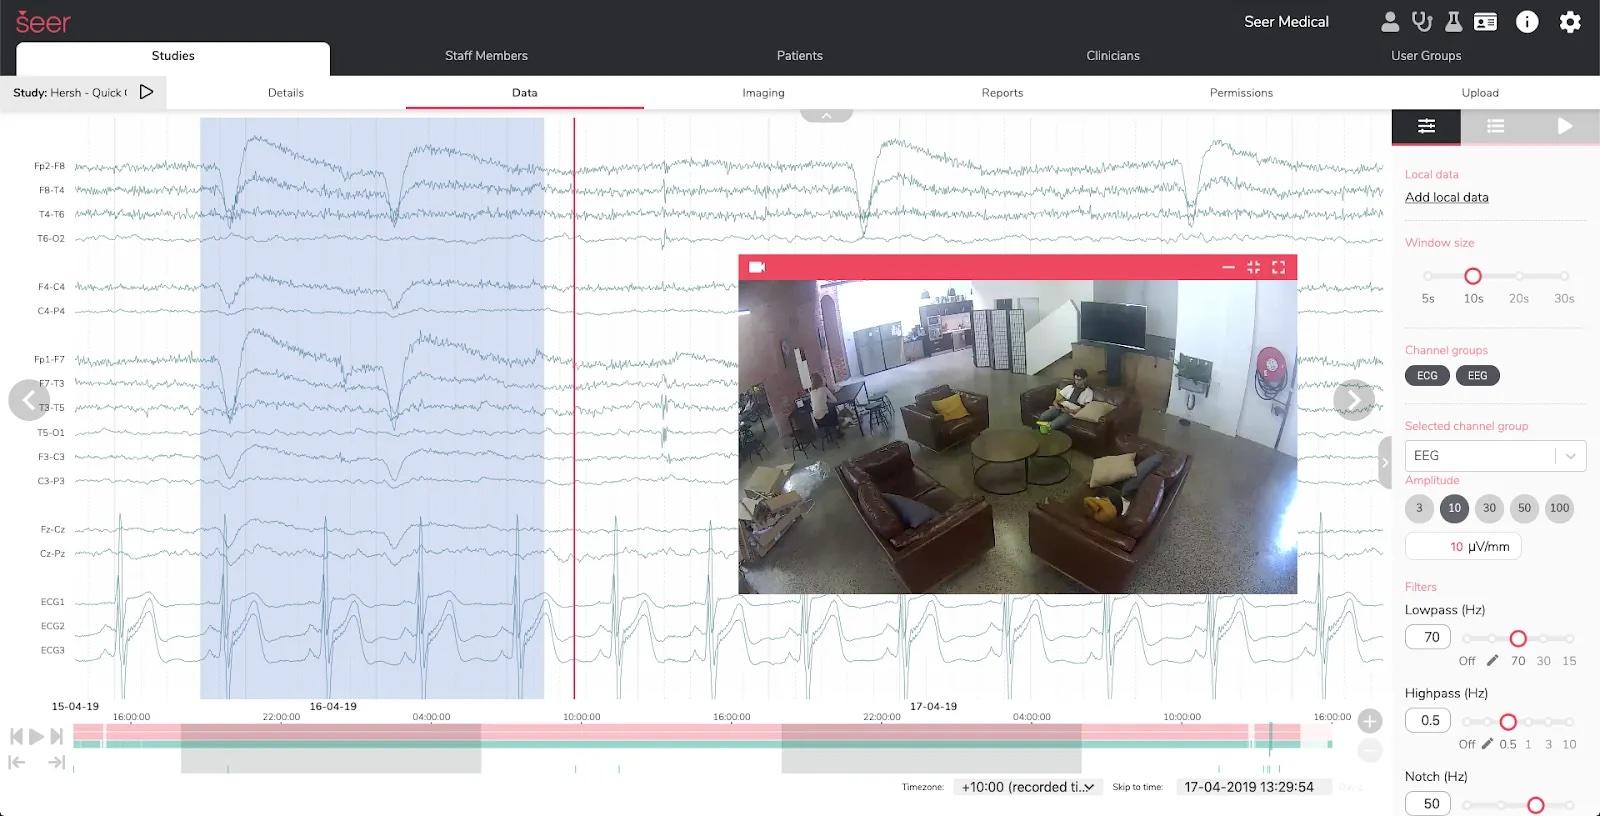
That leaves days of continuous signals and video for every patient. Clinicians have to move through all of it, find the abnormal moments, and check what the patient was doing at each one.
What I did
I was one of the founding members of Seer's software team, and I built the Data Viewer in the Seer Cloud web app, from the backend to the frontend.
The viewer draws each EEG and ECG channel as a trace and keeps a video player locked to the same moment in the recording. Reviewers set the window size, amplitude and filters, switch between channel groups, and move through the whole study on a timeline. The video sits in a panel that can be moved, shrunk or expanded, so it never hides the signal they are reading.
We built it with React and TypeScript, a Node and GraphQL API, PostgreSQL and Python, running on AWS.
Outcome
The Data Viewer became the core of how Seer's clinical team reviewed studies, scanning EEG and ECG in sync with video at up to 40 times normal speed. Referring doctors used the same platform to see their patients' data and reports.